Click on the text bars below to see more details. The images give a colorful idea of what lies below.
There are two dimensionless numbers that describe the dynamics of a stably-stratified fluid. They are given in eq.(1) and (2).

Eq.(1) is the Reynolds number, and it describes the relative strength of forces arising from fluid inertia (on the top line: ρ is the density, and L and U are characteristic length and velocity scales; on the bottom line, μ is the dynamic viscosity). In ocean applications Re can have very large values, such as 10^8 or above for flows around islands and ships (surface or submerged)..
When the motion of a body of size L at speed U occurs in an ambient where the density varies, a new parameter arises, the Froude number, Fr (eq.(2). Work must be done to lift a fluid particle above its neutral equilibrium position, or to drop it below. Fr is a measure of the relative importance of buoyancy forces which resist excursions in the vertical, to quantities that relate to the kinetic energy, or momentum of the fluid. N is a buoyancy frequency and it describes the natural frequency of oscillation of a fluid set in motion in a stable density gradient, where ρ increases with depth, z. In practical applications, Fr varies greatly, from being an order one number for density-stratified flows over islands to 2 orders of magnitude higher for a submerged vehicle.
This preliminary inspection shows that even when flows are high speed or scale, the relative importance of background density gradients is very variable. There are lessons too for decaying flows, where some disturbance occurs and then the resulting flow evolves without further forcing. In such cases, L increases and U decreases faster, so that both Re and Fr decrease. The range of dynamical systems therefore encompasses a very large range of both parameters, and one expects that the flow fields produced and observed will vary correspondingly greatly.
But they don't. At least not always. Read on for examples.
But first, an example of how wakes evolve in a canonical experiment, where a bluff body (sphere) is towed through stratified fluid. The figure below shows 5 repeated experiments. Re is about 5 000, and Fr is around 8. The initial fluid motions are turbulent and quite disorganised so the end state in the right column is not exactly the same. Yet, in each case, the pattern that emerges has a certain regularity and characteristic length scale. The emergence of such pattern is the core focus of our research.
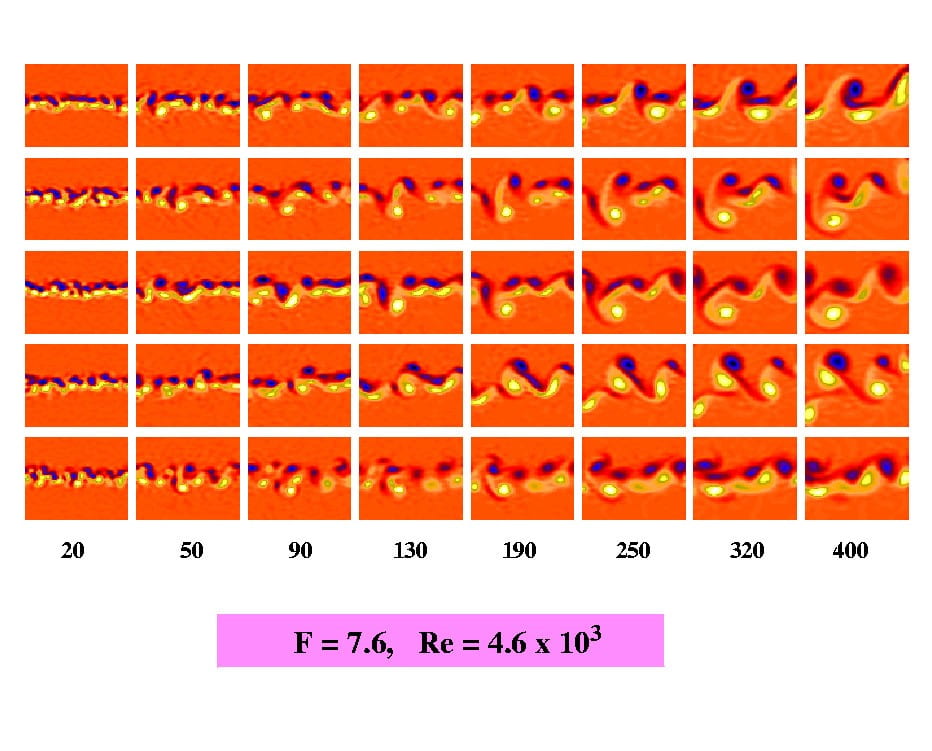

There are two very interesting points to note. First, even at quite long times (hundreds of buoyancy times), the wakes have a regular pattern that changes rather little as time increases over the rightmost two columns. Second, this happens over a range of Fr from 10 to 80. One can show the same thing up to Fr = 300. The message is that even when the background stratification is very weak (high Fr) the wakes remain coherent and last for long times.
This is interesting for a fluid mechanician: why does this happen? What is fundamentally different in these flows from the usual unstratified case, where such patterns do not have a chance to persist? It is also rather interesting for a potential wake detector. Pattern = information. It would be especially interesting if the conditions in the right column could be used to infer something about the wake creator.

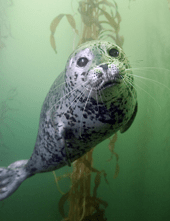
 Harbor seals must find prey in conditions where visibility is low. The long whiskers are sensitive current detectors. (photograph by Kawika Chetron, reproduced by kind permission of his family.)
 In any school, flock or swarm of swimmers or flyers, neighbors know of each other not only from their bodies but also their fluid tracks.
 A Russian Borel-class submarine. Submersibles are difficult to find — by design. The wakes could make effective camouflage harder.

The canonical result for bluff bodies is that there are no differences in wake disturbance evolution, provided one rescales by a quantity related to the drag coefficient. This suggests that all wakes are dynamically similar. But that cannot be so early on in their evolution, as shown in the figure above. The color maps show the time-averaged streamwise velocity in the wakes of a disk (top left), a sphere (top right), and circular grids with large spacing (bottom left) and small spacing (bottom right). The velocity fields are clearly not the same, and differ qualitatively as well as quantitatively. So now the question is — how does this information disappear?
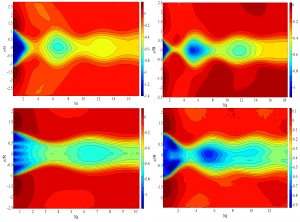
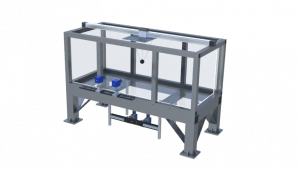
 Fig. 1. The basic tow tank.
Much of our work is based on experiments in tanks of salt-stratified water. Currently, the main tank is 2.5 m long, with height and width about 1 m. We tow objects up and down this tank, and watch what happens. The watching is made quantitative through Particle Imaging Velocimetry (PIV) methods, where the flow is seeded with dense clouds of small particles, whose motion is tracked back to maps of the continuum velocity field. There are a number of cameras — four are shown above — and the reconstructions can be of three velocity components in a plane (3C2D) or of three velocity components in a volume (3C3D). These optical methods are made possible by also seeding the fluid with carefully calibrated am0unts of alcohol so that density variations are not accompanied by refractive index variations.
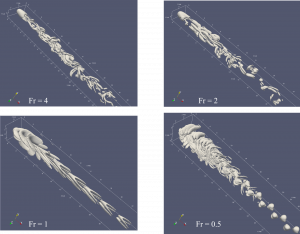 Fig. 2. Surfaces of constant Q show vortex structures shed by a sphere as Fr varies.
As you may have seen from the [basics] section, one of the main governing parameters is the internal Froude number, Fr = U/NL, where U is a flow speed, L a length scale, and N is a buoyancy frequency, which is itself proportional to the strength of the density gradient. All other things being equal, high Fr corresponds to low stratification effects and low Fr to flows where variations in density strongly influence the flow at all scales and time. In fact, when L is suitably defined, Fr = 1 corresponds to a state with perfect resonance between internal wave and convective time scales and the maximum efficacy in wave generation from a body. The peculiar chevron shapes in the lower left corner of Fig. 2 are footprints of wavy motion that impact the vortex wake.
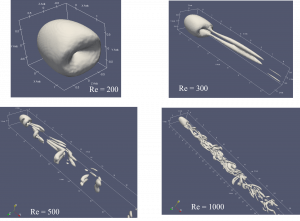 Fig. 3. The variation of sphere wakes with Reynolds number, from 200 to 1000.